In implementing most of the machine learning algorithms, we represent each data point with a feature vector as the input. A vector is basically an array of numerics, or in physics, an object with magnitude and direction. How do we represent our business data in terms of a vector?
Primitive Feature Vector
Whether the data are measured observations, or images (pixels), free text, factors, or shapes, they can be categorized into four following types:
- Categorical data
- Binary data
- Numerical data
- Graphical data
The most primitive representation of a feature vector looks like this:

Numerical Data
Numerical data can be represented as individual elements above (like Tweet GRU, Query GRU), and I am not going to talk too much about it.
Categorical Data
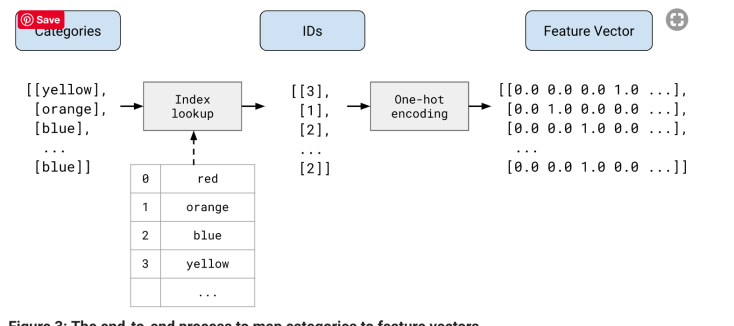
However, for categorical data, how do we represent them? The first basic way is to use one-hot encoding:

For each type of categorical data, each category has an integer code. In the figure above, each color has a code (0 for red, 1 for orange etc.) and they will eventually be transformed to the feature vector on the right, with vector length being the total number of categories found in the data, and the element will be filled with 1 if it is of that category. This allows a natural way of dealing with missing data (with all elements 0) and multi-category (with multiple non-zeros).
In natural language processing, the bag-of-words model is often used to represent free-text data, which is the one-hot encoding above with words as the categories. It is a good way as long as the order of the words does not matter.
Binary Data
For binary data, it can be easily represented by one element, either 1 or 0.
Graphical Data
Graphical data are best represented in terms of graph Laplacian and adjacency matrix. Refer to a previous blog article for more information.
Shortcomings
A feature vector can be a concatenation of various features in terms of all these types except graphical data.
However, such representation that concatenates all the categorical, binary, and numerical fields has a lot of shortcomings:
- Data with different categories are often seen as orthogonal, i.e., perfectly dissimilar. It ignores the correlation between different variables. However, it is a very big assumption.
- The weights of different fields are not considered.
- Sometimes if the numerical values are very large, it outweighs other categorical data in terms of influence in computation.
- Data are very sparse, costing a lot of memory waste and computing time.
- It is unknown whether some of the data are irrelevant.
Modifying Feature Vectors
In light of the shortcomings, to modify the feature factors, there are three main ways of dealing with this:
- Rescaling: rescaling all of some of the elements, or reweighing, to adjust the influence from different variables.
- Embedding: condensing the information into vectors of smaller lengths.
- Sparse coding: deliberately extend the vectors to a larger length.
Rescaling
Rescaling means rescaling all or some of the elements in the vectors. Usually there are two ways:
- Normalization: normalizing all the categories of one feature to having the sum of 1.
- Term frequency-inverse document frequency (tf-idf): weighing the elements so that the weights are heavier if the frequency is higher and it appears in relatively few documents or class labels.
Embedding
Embedding means condensing a sparse vector to a smaller vector. Many sparse elements disappear and information is encoded inside the elements. There are rich amount of work on this.
- Topic models: finding the topic models (latent Dirichlet allocation (LDA), structural topic models (STM) etc.) and encode the vectors with topics instead;
- Global dimensionality reduction algorithms: reducing the dimensions by retaining the principal components of the vectors of all the data, e.g., principal component analysis (PCA), independent component analysis (ICA), multi-dimensional scaling (MDS) etc;
- Local dimensionality reduction algorithms: same as the global, but these are good for finding local patterns, where examples include t-Distributed Stochastic Neighbor Embedding (tSNE) and Uniform Manifold Approximation and Projection (UMAP);
- Representation learned from deep neural networks: embeddings learned from encoding using neural networks, such as auto-encoders, Word2Vec, FastText, BERT etc.
- Mixture Models: Gaussian mixture models (GMM), Dirichlet multinomial mixture (DMM) etc.
- Others: Tensor decomposition (Schmidt decomposition, Jennrich algorithm etc.), GloVe etc.
Sparse Coding
Sparse coding is good for finding basis vectors for dense vectors.
