Topology in Physics and Computing

Topology has been shown to reveal important information about geometry and shape from data, [Carlsson 2015][Carlsson 2009] as I have talked about in various TDA blog entries. I have also demonstrated how to describe the topology if discrete data points by constructing simplicial complexes, and then calculated the homology and Betti numbers. (I will talk about persistent homology in the future.) Dealing with discrete data points in our digital storage devices, homology is the best way to describe it.

But if you are from a physics background, you may be familiar with the concept of homotopy and fundamental group. Some physicists deal with topology without digging into advanced mathematical tools but simply through solitons. There is a well-written introduction in this blog. In the physical world, an object is said to be topological if:

  • there is a singular point that cannot be removed by a continuous deformation of field; [Mermin 1979]
  • it has a saddle-point equation of the model that is different from another object of another topology, [Rajaraman 1987] inducing different kinds of physical dynamics; [Bray 1994]
  • it can only be removed by crossing an energy barrier, which can be described by an instanton; [Calzetta, Ho, Hu 2010]
  • it can proliferate through Kosterlitz-Thouless (BKT) phase transition; [Kosterliz, Thouless 1973]
  • it can form in a system through a second-order phase transition at a finite rate, a process known as Kibble-Zurek mechanism (KZM); [Kibble 1976] [Zurek 1985] and
  • its topology can be described by a winding number. (c.f. Betti numbers in homology)

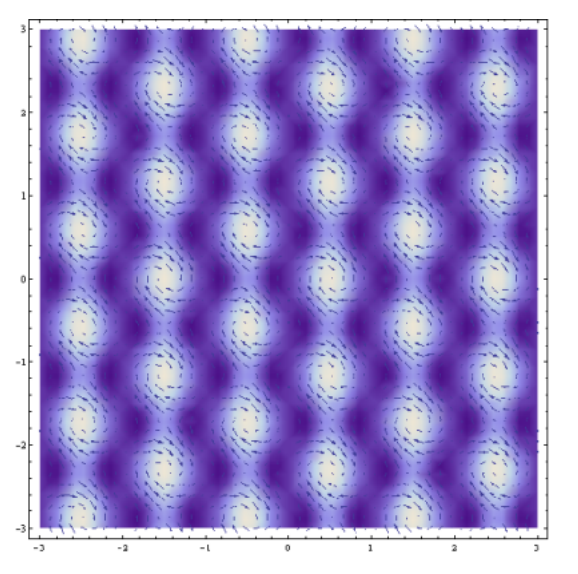
Topological objects include vortices in magnets, superfluids, superconductors, or Skyrmions in helimagnets. [Mühlbauer et. al. 2009] [Ho et. al. 2010] They may come in honeycomb order, like Abrikosov vortices in type-II superconductors, [Abrikosov 1957] and helical nanofilaments in smectics. [Matsumoto et. al. 2009] It is widely used in fractional quantum Hall effect [Tsui et. al. 1982] and topological insulators (a lot of references can be found…). They can all be described using homotopy and winding numbers. We can see that topology is useful to describe the physical world for the complexities and patterns. There are ideas in string-net theory to use topology to describe the emergence of patterns and new phases of quantum matter. [Zeng et. al. 2015] Of course, I must not omit topological quantum computing that makes the qubits immune to environmental noise. [Das Sarma, Freedman, Nayak 2005]

However in data analytics, we do not use homotopy, albeit its beauty and usefulness in the physical world. Here are some of the reasons:

  • In using homotopy, sometimes it takes decades for a lot of brains to figure out which homotopy groups to use. But in data analysis, we want to grasp the topology simply from data.
  • Homotopy deals with continuous mappings, but data are discrete. Simplicial homology captures it more easily.
  • In a physical system, we deal with usually one type of homotopy groups. But in data, we often deal with various topologies which we are not aware of in advance. Betti numbers can describe the topology easily by looking at data.
  • Of course, homotopy is difficult to compute numerically.

Afra Zomorodian argued the use of homology over homotopy in his book as well. [Zomorodian 2009]
Continue reading “Topology in Physics and Computing”

Statistics Nowadays

tmp1

There is no doubt that everyone who are in the so-called big data industry must know some statistics. However, statistics means differently to different peoples.

Traditional Statistics

Statistics is an old field that was developed in the 18th century. In those times, people were urged to make conclusions out of a vast amount of data which were virtually not available, or were very costly to obtain. For example, someone wanted to know the average salary of the whole population, which required the census staff to survey the information from everyone in the population. It was something expensive to do in the old days. Therefore, sampling techniques were devised, and the wanted quantities can be estimated using an appropriate statistic.

Or when the scientists performed an experiment, even one data point costs a few million dollars. The experiments had to be designed in a way that the scientists extract the wanted information by looking at a few data points.

Or in testing some hypotheses, one needs to know only how to accept or reject a hypothesis using the statistical information available.

Hence, the traditional statistics is a body of knowledge that deduce the information of a whole population from a limited amount of data from a sample.

Theoretical Statistical Physics

There is a branch in physics called statistical physics, which originated from the 19th century. Later it became useful since Albert Einstein published its paper on Brownian motion in 1905. And now the methods in statistical physics is not only applied in solid state physics or condensed matter physics, but also in biophysics (e.g., diffusion), econophysics (e.g., the fairness and wealth distribution, see this previous blog post), and quantitative finance (e.g., binomial model, and its relation with Black-Scholes equation).

The techniques involved in statistical physics includes is the knowledge of probability theory and stochastic calculus (such as Ito calculus). Of course, it is how entropy, a concept from thermodynamics, entered probability theory and information theory. Extracted quantity are mostly expectation values and correlations, which are of interest to theorists.

This is very different from traditional statistics. When people know that I am a statistical physicist, they expect me to be familiar with t-test, which is not really the case. (Very often I have to look up every time I used them.)

Statistics in the Computing World

Unlike in traditional statistics or statistical physics, nowadays, we often get the statistical information directly from a vast amount of available data, thanks to the advance of technology and the reducing cost to access the technology. You can easily calculate the average salary of a population by a single command line on R or Python. Hence, statistics is no longer about extracting information from a limited amount of data, but a vast amount of data.

On the other hand, mathematical modeling is still important, but in a different sense. Models in statistical physics describes the world, but in information retrieval, models are built according to what we need.

P.S.: Philipp Janert wrote something similar in his Chapter 10 (“What You Really Need to Know About Classical Statistics”) in his “Data Analysis Using Open Source Tools“:

The basic statistical methods that we know today were developed in the late 19th and early 20th centuries, mostly in Great Britain, by a very small group of people. Of those, one worked for the Guinness brewing company and another—the most influential one of them—worked at an agricultural research lab (trying to increase crop yields and the like). This bit of historical context tells us something about their working conditions and primary challenges.

No computational capabilities All computations had to be performed with paper and pencil.

No graphing capabilities, either All graphs had to be generated with pencil, paper, and a ruler. (And complicated graphs—such as those requiring prior transformations or calculations using the data—were especially cumbersome.)

Very small and very expensive data sets Data sets were small (often not more than four to five points) and could be obtained only with great difficulty. (When it always takes a full growing season to generate a new data set, you try very hard to make do with the data you already have!)

In other words, their situation was almost entirely the opposite of our situation today:

  • Computational power that is essentially free (within reason)
  • Interactive graphing and visualization capabilities on every desktop
  • Often huge amounts of data

It should therefore come as no surprise that the methods developed by those early researchers seem so out of place to us: they spent a great amount of effort and ingenuity solving problems we simply no longer have! This realization goes a long way toward explaining why classical statistics is the way it is and why it often seems so strange to us today.

P.S.: The graph at the beginning of this blog entry was plotted in Mathematica, by running the following:

Plot[Evaluate@Table[PDF[MaxwellDistribution[σ], x], {σ, {1, 2, 3}}], {x, 0, 10}, Filling -> Axis]

Continue reading “Statistics Nowadays”

Blog at WordPress.com.

Up ↑