Neural-Network Representation of Quantum Many-Body States

There are many embeddings algorithm for representations. Sammon embedding is the oldest one, and we have Word2Vec, GloVe, FastText etc. for word-embedding algorithms. Embeddings are useful for dimensionality reduction.

Traditionally, quantum many-body states are represented by Fock states, which is useful when the excitations of quasi-particles are the concern. But to capture the quantum entanglement between many solitons or particles in a statistical systems, it is important not to lose the topological correlation between the states. It has been known that restricted Boltzmann machines (RBM) have been used to represent such states, but it has its limitation, which Xun Gao and Lu-Ming Duan have stated in their article published in Nature Communications:

There exist states, which can be generated by a constant-depth quantum circuit or expressed as PEPS (projected entangled pair states) or ground states of gapped Hamiltonians, but cannot be efficiently represented by any RBM unless the polynomial hierarchy collapses in the computational complexity theory.

PEPS is a generalization of matrix product states (MPS) to higher dimensions. (See this.)

However, Gao and Duan were able to prove that deep Boltzmann machine (DBM) can bridge the loophole of RBM, as stated in their article:

Any quantum state of n qubits generated by a quantum circuit of depth T can be represented exactly by a sparse DBM with O(nT) neurons.

41467_2017_705_fig3_html

(diagram adapted from Gao and Duan’s article)

Continue reading “Neural-Network Representation of Quantum Many-Body States”

R or Python on Text Mining

rpythontextmining

I have seen more than enough debates about R or Python. While I do have a preference towards Python, I am happy with using R as well. I am not agnostic about languages, but we choose tools according to needs. The needs may be about effectiveness, efficiency, availability of tools, nature of problems, collaborations, etc. Yes, in a nutshell, it depends.

When dealing with text mining, although I still prefer Python, I have to fairly say that both languages have their own strengths and weaknesses. What do you do in text mining? Let me casually list the usual steps:

  1. Removing special characters,
  2. Removing numerals,
  3. Converting all alphabets to lower cases,
  4. Removing stop words, and
  5. Stemming the words (using Porter stemmer).

They are standard steps. But of course, sometimes we perform lemmatization instead of stemming. Sometimes we keep numerals. Or whatever. It is okay.

How do u do that in Python? Suppose you have a list of text documents stored in the variable texts, which is defined by

texts = ['I love Python.',
         'R is good for analytics.',
         'Mathematics is fun.']

. Then

# import all necessary libraries
from nltk.stem import PorterStemmer
from nltk.tokenize import SpaceTokenizer
from nltk.corpus import stopwords
from functools import partial
from gensim import corpora
from gensim.models import TfidfModel
import re

# initialize the instances for various NLP tools
tokenizer = SpaceTokenizer()
stemmer = PorterStemmer()

# define each steps
pipeline = [lambda s: re.sub('[^\w\s]', '', s),
            lambda s: re.sub('[\d]', '', s),
            lambda s: s.lower(),
            lambda s: ' '.join(filter(lambda s: not (s in stopwords.words()), tokenizer.tokenize(s))),
            lambda s: ' '.join(map(lambda t: stemmer.stem(t), tokenizer.tokenize(s)))
           ]

# function that carries out the pipeline step-by-step
def preprocess_text(text, pipeline):
    if len(pipeline)==0:
        return text
    else:
        return preprocess_text(pipeline[0](text), pipeline[1:])

# preprocessing
preprocessed_texts = map(partial(preprocess_text, pipeline=pipeline), texts)

# converting to feature vectors
documents = map(lambda s: tokenizer.tokenize(s), texts)
corpus = [dictionary.doc2bow(document) for document in documents]
tfidfmodel = TfidfModel(corpus)

We can train a classifier with the feature vectors output by tfidfmodel. To do the prediction, we can get the feature vector for a new text by calling:

bow = dictionary.doc2bow(tokenizer.tokenize(preprocess_text(text, pipeline)))

How about in R? To perform the preprocessing steps and extract the feature vectors, run:

library(RTextTools)
library(tm)

origmatrix<-create_matrix(textColumns = texts, language = 'english',
                          removeNumbers = TRUE, toLower = TRUE,
                          removeStopwords = 'TRUE', stemWords = TRUE,
                          weighting=tm::weightTfIdf, originalMatrix=NULL)

After we have a trained classifier, and we have a new text to preprocess, then we run:

matrix<-create_matrix(textColumns = newtexts, language = 'english',
                      removeNumbers = TRUE, toLower = TRUE,
                      removeStopwords = 'TRUE', stemWords = TRUE,
                      weighting=tm::weightTfIdf, originalMatrix=origmatrix)

Actually, from this illustration, a strength for R stands out: brevity. However, very often we want to preprocess in other ways, Python allows more flexibility without making it complicated. And Python syntax itself is intuitive enough.

And there are more natural language processing libraries in Python available, such as nltk and gensim, that are associated with its other libraries perfectly such as numpy, scipy and scikit-learn. But R is not far away in terms of this actually, as it has libraries such as tm and RTextTools, while R does not have numpy-like libraries because R itself is designed to perform calculations like this.

Python can be used to develop larger software projects by making the codes reusable, and it is obviously a weakness for R.

However, do perform analysis, R makes the task very efficient if we do not require something unconventional.

In the area of text mining, R or Python? My answer is: it depends.

Continue reading “R or Python on Text Mining”

Starting the Journey of Topological Data Analysis (TDA)

Topology has been around for centuries, but it did not catch the attention of many data analysts until recently. In an article published in Nature Scientific Reports, the authors demonstrated the power of topology in data analysis through examples including gene expression from breast rumors, voting data in the United States, and player performance data from the NBA. [Lum et. al. 2013]

As an introduction, they described topological methods “as a geometric approach to pattern or shape recognition within data.” It is true that in machine learning, we never care enough pattern recognition, but topology adds insights regarding the shapes of data that do not change with continuous deformation. For example, a circle and an ellipse have “the same topology.” The distances between data points are not as important as the shape. Traditional machine learning methods deal with feature vectors, distances, or classifications, but the topology of the data is usually discarded. Gunnar Carlsson demonstrated in a blog that a thin ellipse of data may be misrepresented as two straight parallel lines or one straight lines. [Carlsson 2015] Dimensionality reduction algorithms such as principal component analysis (PCA) often disregard the topology as well. (I heard that Kohenen’s self-organizing maps (SOM) [Kohonen 2000] retain the topology of higher dimensional data during the dimensionality reduction, but I am not confident enough to say that.)

Euler introduced the concept of topology in the 18th century. Topology has been a big subject in physics since 1950s. The string theory, as one of the many efforts in unifying gravity and other three fundamental forces, employs topological dimensions. In condensed matter physics, the fractional quantum Hall effect is a topological quantum effect. There are topological solitons [Rajaraman 1987] such as quantum vortices in superfluids, [Simula, Blakie 2006; Calzetta, Ho, Hu 2010] columns of topological solitons (believed to be Skyrmions) in helical magnets, [Mühlbauer et. al. 2009; Ho et. al. 2010; Ho 2012] hexagonal solitonic objects in smectic liquid crystals [Matsumoto et. al. 2009]… When a field becomes sophisticated, it becomes quantitative; when a quantitative field becomes sophisticated, it requires abstract mathematics such as topology for a general description. I believe analysis on any kinds of data is no exception.

There are some good reviews and readings about topological data analysis (TDA) out there, for example, the ones by Gunnar Carlsson [Carlsson 2009] and Afra Zomorodian [Zomorodian 2011]. While physicists talk about homotopy, data analysts talk about persistent homology as it is easier to compute. Data have to be described in a simplicial complex or a graph/network. Then the homology can be computed and represented in various ways such as barcodes. [Ghrist 2008] Then we extract insights about the data from it.

Topology has a steep learning curve. I am also a starter learning about this. This blog entry will not be the last talking about TDA. Therefore, I opened a new session called TDA for all of my blog entries about it. Let’s start the journey!

There is an R package called “TDA” that facilitates topological data analysis. [Fasy et. al. 2014] A taste of homology of a simplicial complex is also demonstrated in a Wolfram demo.

New-big-data-firm-to-pion-008
(Taken from TheGuardian)

Continue reading “Starting the Journey of Topological Data Analysis (TDA)”

Ranking Everything: an Overview of Link Analysis Using PageRank Algorithm

This is an age of quantification, meaning that we want to give everything, even qualitative, a number. In schools, teachers measure how good their students master mathematics by grading, or scoring their homework. The funding agencies measure how good a scientist is by counting the number of his publications, the citations, and the impact factors. We measure how successful a person is by his annual income. We can question all these approaches of measurement. Yet however good or bad the measures are, we look for a metric to measure.

Original PageRank Algorithm

We measure webpages too. In the early ages of Internet, people performed searching on sites such as Yahoo or AltaVista. The keywords they entered are the main information for the browser to do the searching. However, a big problem was that a large number of low quality or irrelevant webpages showed up in search results. Some were due to malicious manipulation of keyword tricks. Therefore, it gave rise a need to rank the webpages. Larry Page and Sergey Brin, the founders of Google, tackled this problem as a thesis topic in Stanford University. But this got commercialized, and Brin never received his Ph.D. They published their algorithm, called PageRank, named after Larry Page, at the Seventh International World Wide Web Conference (WWW7) in April 1998. [Brin & Page 1998] This algorithm is regarded as one of the top ten algorithms in data mining by a survey paper published in the IEEE International Conference on Data Mining (ICDM) in December 2006. [Wu et. al. 2008]

Google-s-Larry-Page-and-Sergey-Brin-Are-3-2-19-Billion-Richer-in-One-Day-392729-2
Larry Page and Sergey Brin (source)

The idea of the PageRank algorithm is very simple. It regards each webpage as a node, and each link in the webpage as a directional edge from the source to the target webpage. This forms a network, or a directed graph, of webpages connected by their links. A link is seen as a vote to the target homepage, and if the source homepage ranks high, it enhances the target homepage’s ranking as well. Mathematically it involves solving a large matrix using Newton-Raphson’s method. (Technologies involving handling the large matrix led to the MapReduce programming paradigm, another big data trend nowadays.)

figure_1_webnet
Example (made by Python with packages networkx and matplotlib)

Let’s have an intuition through an example. In the network, we can easily see that “Big Data 1” has the highest rank because it has the most edges pointing to it. However, there are pages such as “Big Data Fake 1,” which looks like a big data page, but in fact it points to “Porn 1.” After running the PageRank algorithm, it does not have a high rank. The sample of the output is:

[('Big Data 1', 0.00038399273501500979),
('Artificial Intelligence', 0.00034612564364377323),
('Deep Learning 1', 0.00034221161094691966),
('Machine Learning 1', 0.00034177713235138173),
('Porn 1', 0.00033859136614724074),
('Big Data 2', 0.00033182629176238337),
('Spark', 0.0003305912073357307),
('Hadoop', 0.00032928389859040422),
('Dow-Jones 1', 0.00032368956852396916),
('Big Data 3', 0.00030969537721207128),
('Porn 2', 0.00030969537721207128),
('Big Data Fake 1', 0.00030735245262038724),
('Dow-Jones 2', 0.00030461420169420618),
('Machine Learning 2', 0.0003011838672138951),
('Deep Learning 2', 0.00029899313444392865),
('Econophysics', 0.00029810944592071552),
('Big Data Fake 2', 0.00029248837867043803),
('Wall Street', 0.00029248837867043803),
('Deep Learning 3', 0.00029248837867043803)]

You can see those pornographic webpages that pretend to be big data webpages do not have rank as high as those authentic ones. PageRank fights against spam and irrelevant webpages. Google later further improved the algorithm to combat more advanced tricks of spam pages.

You can refer other details in various sources and textbooks. [Rajaraman and Ullman 2011, Wu et. al. 2008]

Use in Social Media and Forums

Mathematically, the PageRank algorithm deals with a directional graph. As one can imagine, any systems that can be modeled as directional graph allow rooms for applying the PageRank algorithm. One extension of PageRank is ExpertiseRank.

Jun Zhang, Mark Ackerman and Lada Adamic published a conference paper in the International World Wide Web (WWW7) in May 2007. [Zhang, Ackerman & Adamic 2007] They investigated into a Java forum, by connecting users to posts and anyone replying to it as a directional graph. With an algorithm closely resembled PageRank, they found the experts and influential people in the forum.

expertiserank
Graphs in ExpertiseRank (take from [Zhang, Ackerman & Adamic 2007])

There are other algorithms like HITS (Hypertext induced topic selection) that does similar things. And social media such as Quora (and its Chinese counterpart, Zhihu) applied a link analysis algorithm (probabilistic topic network, see this.) to perform topic network building. Similar ideas are also applied to identify high-quality content in Yahoo! Answers. [Agichtein, Castillo, Donato, Gionis & Mishne 2008]

Use in Finance and Econophysics

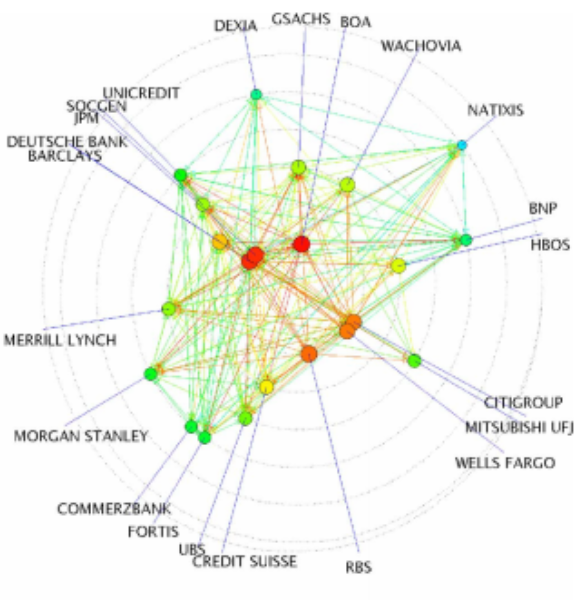
PageRank algorithm is also applied outside information technology fields. Financial engineers and econophysicists applied an algorithm, called DebtRank, which is very similar to PageRank, to determine the systemically important financial institutions in a financial network. This work is published in Nature Scientific Reports. [Battiston, Puliga, Kaushik, Tasca & Caldarelli 2012] In their study, each node represents a financial institution, and a directional edge means the estimated potential impact of an institution to another one. Using DebtRank, we are able to identify the centrally important institutions that potentially impacted other institutions in the network once a financial crisis occurs.

debtrank
D
ebtRank network, taken from [Battiston, Puliga, Kaushik, Tasca & Caldarelli 2012])

Continue reading “Ranking Everything: an Overview of Link Analysis Using PageRank Algorithm”

Create a free website or blog at WordPress.com.

Up ↑