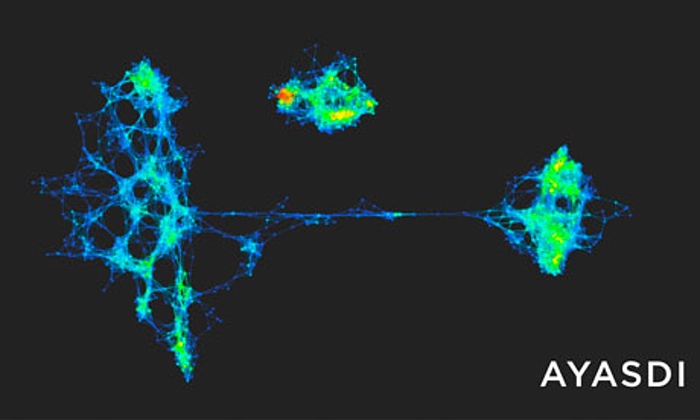
Topology has been around for centuries, but it did not catch the attention of many data analysts until recently. In an article published in Nature Scientific Reports, the authors demonstrated the power of topology in data analysis through examples including gene expression from breast rumors, voting data in the United States, and player performance data from the NBA. [Lum et. al. 2013]
As an introduction, they described topological methods “as a geometric approach to pattern or shape recognition within data.” It is true that in machine learning, we never care enough pattern recognition, but topology adds insights regarding the shapes of data that do not change with continuous deformation. For example, a circle and an ellipse have “the same topology.” The distances between data points are not as important as the shape. Traditional machine learning methods deal with feature vectors, distances, or classifications, but the topology of the data is usually discarded. Gunnar Carlsson demonstrated in a blog that a thin ellipse of data may be misrepresented as two straight parallel lines or one straight lines. [Carlsson 2015] Dimensionality reduction algorithms such as principal component analysis (PCA) often disregard the topology as well. (I heard that Kohenen’s self-organizing maps (SOM) [Kohonen 2000] retain the topology of higher dimensional data during the dimensionality reduction, but I am not confident enough to say that.)
Euler introduced the concept of topology in the 18th century. Topology has been a big subject in physics since 1950s. The string theory, as one of the many efforts in unifying gravity and other three fundamental forces, employs topological dimensions. In condensed matter physics, the fractional quantum Hall effect is a topological quantum effect. There are topological solitons [Rajaraman 1987] such as quantum vortices in superfluids, [Simula, Blakie 2006; Calzetta, Ho, Hu 2010] columns of topological solitons (believed to be Skyrmions) in helical magnets, [Mühlbauer et. al. 2009; Ho et. al. 2010; Ho 2012] hexagonal solitonic objects in smectic liquid crystals [Matsumoto et. al. 2009]… When a field becomes sophisticated, it becomes quantitative; when a quantitative field becomes sophisticated, it requires abstract mathematics such as topology for a general description. I believe analysis on any kinds of data is no exception.
There are some good reviews and readings about topological data analysis (TDA) out there, for example, the ones by Gunnar Carlsson [Carlsson 2009] and Afra Zomorodian [Zomorodian 2011]. While physicists talk about homotopy, data analysts talk about persistent homology as it is easier to compute. Data have to be described in a simplicial complex or a graph/network. Then the homology can be computed and represented in various ways such as barcodes. [Ghrist 2008] Then we extract insights about the data from it.
Topology has a steep learning curve. I am also a starter learning about this. This blog entry will not be the last talking about TDA. Therefore, I opened a new session called TDA for all of my blog entries about it. Let’s start the journey!
There is an R package called “TDA” that facilitates topological data analysis. [Fasy et. al. 2014] A taste of homology of a simplicial complex is also demonstrated in a Wolfram demo.

(Taken from TheGuardian)
- P. Y. Lum, G. Singh, A. Lehman, T. Ishkanov, M. Vejdemo-Johansson, M. Alagappan, J. Carlsson, G. Carlsson, “Extracting insights from the shape of complex data using topology”, Sci. Rep. 3, 1236 (2013).
- G. Carlsson, “Why Topological Data Analysis Works”, Ayasdi (2015).
- T. Kohenon, “Self-Organizing Map“, Springer (2000).
- R. Rajaraman, “Solitons and Instantons, Volume 15: An Introduction to Solitons and Instantons in Quantum Field Theory“, North-Holland (1987).
- T. P. Simula, P. B. Blakie, “Thermal Activation of Vortex-Antivortex Pairs in Quasi-Two-Dimensional Bose-Einstein Condensates”, Phys. Rev. Lett. 96, 020404 (2006).
- E. Calzetta, K.-Y. Ho, B. L. Hu, “Vortex Formation in Two-Dimensional Bose Gases”, J. Phys. B: At. Mol. Opt. Phys. 43, 095004 (2010).
- S. Mühlbauer, B. Binz, F. Jonietz, C. Pfleiderer, A. Rosch, A. Neubauer, R. Georgii, P. Böni, “Skyrmion Lattice in a Chiral Magnet”, Science 323, 919-919 (2009).
- K.-Y. Ho, T. R. Kirkpatrick, Y. Sang, D. Belitz, “Ordered phases of itinerant Dzyaloshinsky-Moriya magnets and their electronic properties”, Phys. Rev. B 82, 134427 (2010).
- K.-Y. Ho, “Properties of Metallic Helimagnets“, Ph.D. thesis (University of Maryland) (2012).
- E. A. Matsumoto, G. P. Alexander, R. D. Kamien, “Helical Nanofilaments and the High Chirality Limit of Smectics A”, Phys. Rev. Lett. 253, 257804 (2009).
- G. Carlsson, “Topology and Data”, Bull. Amer. Math. Soc. 46, 255-308 (2009).
- A. Zomorodian, “Topological Data Analysis”, Proceedings of Symposia in Applied Mathematics (2011).
- R. Ghrist, “Barcodes: the Persistent Topology of Data”, Bull. Amer. Math. Soc. 45, 61-75 (2008).
- B. T. Fasy, J. Kim, F. Lecci, C. Maria, “Introduction to the R package TDA”, arXiv:1411.1830 (2014). [“TDA” package in R]
- R. Henningan, “Simplicial Homology of the Alpha Complex”, Wolfram Demonstration.
