In text mining, it is important to create the document-term matrix (DTM) of the corpus we are interested in. A DTM is basically a matrix, with documents designated by rows and words by columns, that the elements are the counts or the weights (usually by tf-idf). Subsequent analysis is usually based creatively on DTM.
Exploring with DTM therefore becomes an important issues with a good text-mining tool. How do we perform exploratory data analysis on DTM using R and Python? We will demonstrate it using the data set of U. S. Presidents’ Inaugural Address, preprocessed, and can be downloaded here.
R: textmineR
In R, we can use the package textmineR, which has been in introduced in a previous post. Together with other packages such as dplyr (for tidy data analysis) and snowBall (for stemming), load all of them at the beginning:
library(dplyr)
library(textmineR)
library(SnowballC)
Load the datasets:
usprez.df<- read.csv('inaugural.csv', stringsAsFactors = FALSE)
Then we create the DTM, while we remove all digits and punctuations, make all letters lowercase, and stem all words using Porter stemmer.
dtm<- CreateDtm(usprez.df$speech,
                doc_names = usprez.df$yrprez,
                ngram_window = c(1, 1),
                lower = TRUE,
                remove_punctuation = TRUE,
                remove_numbers = TRUE,
                stem_lemma_function = wordStem)
Then defining a set of functions:
get.doc.tokens<- function(dtm, docid)
  dtm[docid, ] %>% as.data.frame() %>% rename(count=".") %>%
  mutate(token=row.names(.)) %>% arrange(-count)

get.token.occurrences<- function(dtm, token)
  dtm[, token] %>% as.data.frame() %>% rename(count=".") %>%
  mutate(token=row.names(.)) %>% arrange(-count)

get.total.freq<- function(dtm, token) dtm[, token] %>% sum

get.doc.freq<- function(dtm, token)
  dtm[, token] %>% as.data.frame() %>% rename(count=".") %>%
  filter(count>0) %>% pull(count) %>% length
Then we can happily extract information. For example, if we want to get the top-most common words in 2009’s Obama’s speech, enter:
dtm %>% get.doc.tokens('2009-Obama') %>% head(10)
Or which speeches have the word “change”: (but need to stem the word before extraction)
dtm %>% get.token.occurrences(wordStem('change')) %>% head(10)
You can also get the total number of occurrence of the words by:
dtm %>% get.doc.freq(wordStem('change')) # gives 28
Python: shorttext
In Python, similar things can be done using the package shorttext, described in a previous post. It uses other packages such as pandas and stemming. Load all packages first:
import shorttext
import numpy as np
import pandas as pd
from stemming.porter import stem

import re
And define the preprocessing pipelines:
pipeline = [lambda s: re.sub('[^\w\s]', '', s),
            lambda s: re.sub('[\d]', '', s),
            lambda s: s.lower(),
            lambda s: ' '.join(map(stem, shorttext.utils.tokenize(s)))
 ]
txtpreproceesor = shorttext.utils.text_preprocessor(pipeline)
The function <code>txtpreprocessor</code> above perform the functions we talked about in R.
Load the dataset:
usprezdf = pd.read_csv('inaugural.csv')
The corpus needs to be preprocessed before putting into the DTM:
docids = list(usprezdf['yrprez'])    # defining document IDs
corpus = [txtpreproceesor(speech).split(' ') for speech in usprezdf['speech']]
Then create the DTM:
dtm = shorttext.utils.DocumentTermMatrix(corpus, docids=docids, tfidf=False)
Then we do the same thing as we have done above. To get the top-most common words in 2009’s Obama’s speech, enter:
dtm.get_doc_tokens('2009-Obama')
Or we look up which speeches have the word “change”:
dtm.get_token_occurences(stem('change'))
Or to get the document frequency of the word:
dtm.get_doc_frequency(stem('change'))
They Python and R codes give different document frequencies probably because the two stemmers work slightly differently.
- CRAN: textmineR [CRAN]; Github: TommyJones/textmineR. [Github]
- “textmineR: a new text mining package for R,” Everything in Data Analytics, WordPress (2016). [WordPress]
- “A Grammar for Data Manipulation: dplyr.” [Tidyverse]
- PyPI: shorttext. [PyPI]; Github: stephenhky/shorttext. [Github]; ReadTheDocs: shorttext. [RTFD]
- “Python Package for Short Text Mining,” Everything in Data Analytics, WordPress (2016). [WordPress]

Hi you have done a excellent job. Your examples are outstanding. Thanks a lot.
Data Analytics Using R
LikeLike
Thanks!
LikeLiked by 1 person
Nice decision but for Python from stemming.porter import stem is no longer available. Please recommend what to use for Russian language stemming instead. Thank’s in advance.
LikeLike
Thanks for letting me know about the deprecation. I think you can now use spacy for stemming.
I do not speak any Russian, but a Google search points me to snowball.
LikeLike
Hello,
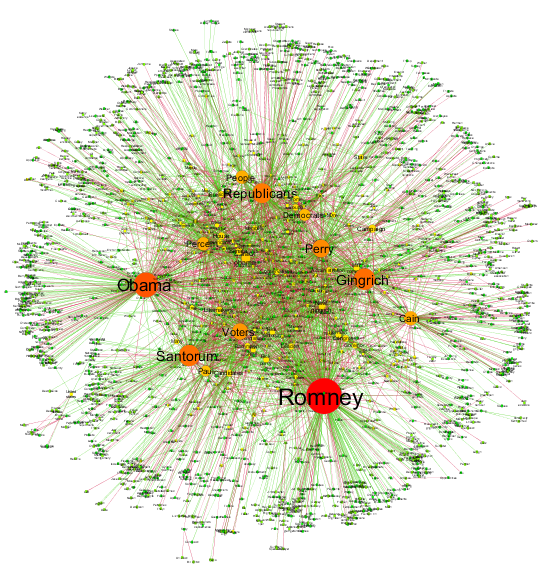
I was wondering how you went about modeling your results (picture at the top).
I am able to create my document term matrix, but I am having trouble thinking of a way to graphically represent which terms occur most often across all the different documents.
Thank you
LikeLike
The figure above is a wordcloud result. But to graph the document matrix, you can use density map.
LikeLike
Many thanks for an excellent job.
I also have a question about modeling the result. The code you showed can just get the single word result, but how to check all results and make a network analysis like the picture at the top.
Thanks
LikeLike
The featured image (or the feature at the top) is more than the DT matrix. It is more about the network analysis or graph theory, where one explored the relationship between words. It is quite another domain knowledge.
LikeLike
Thanks a lot !!
I know how to do the network analysis, and I am thinking whether I can use the result of DT matrix to get the network analysis
The problem I have is how to check the whole result of the DT matrix, since the code “get_token_occurences” and “get_doc_frequency” can only get the single one.
Thank you very much
LikeLike
In the R version the code for creating docids is missing
LikeLike